where product meets causal inference analysis
The feature was supposed to be a game-changer. After months of painstaking user interviews, wireframes, and late-night sprints, you finally shipped. You crack open the A/B test dashboard with equal parts excitement and dread… only to see the primary KPI as flat as a mill-pond.
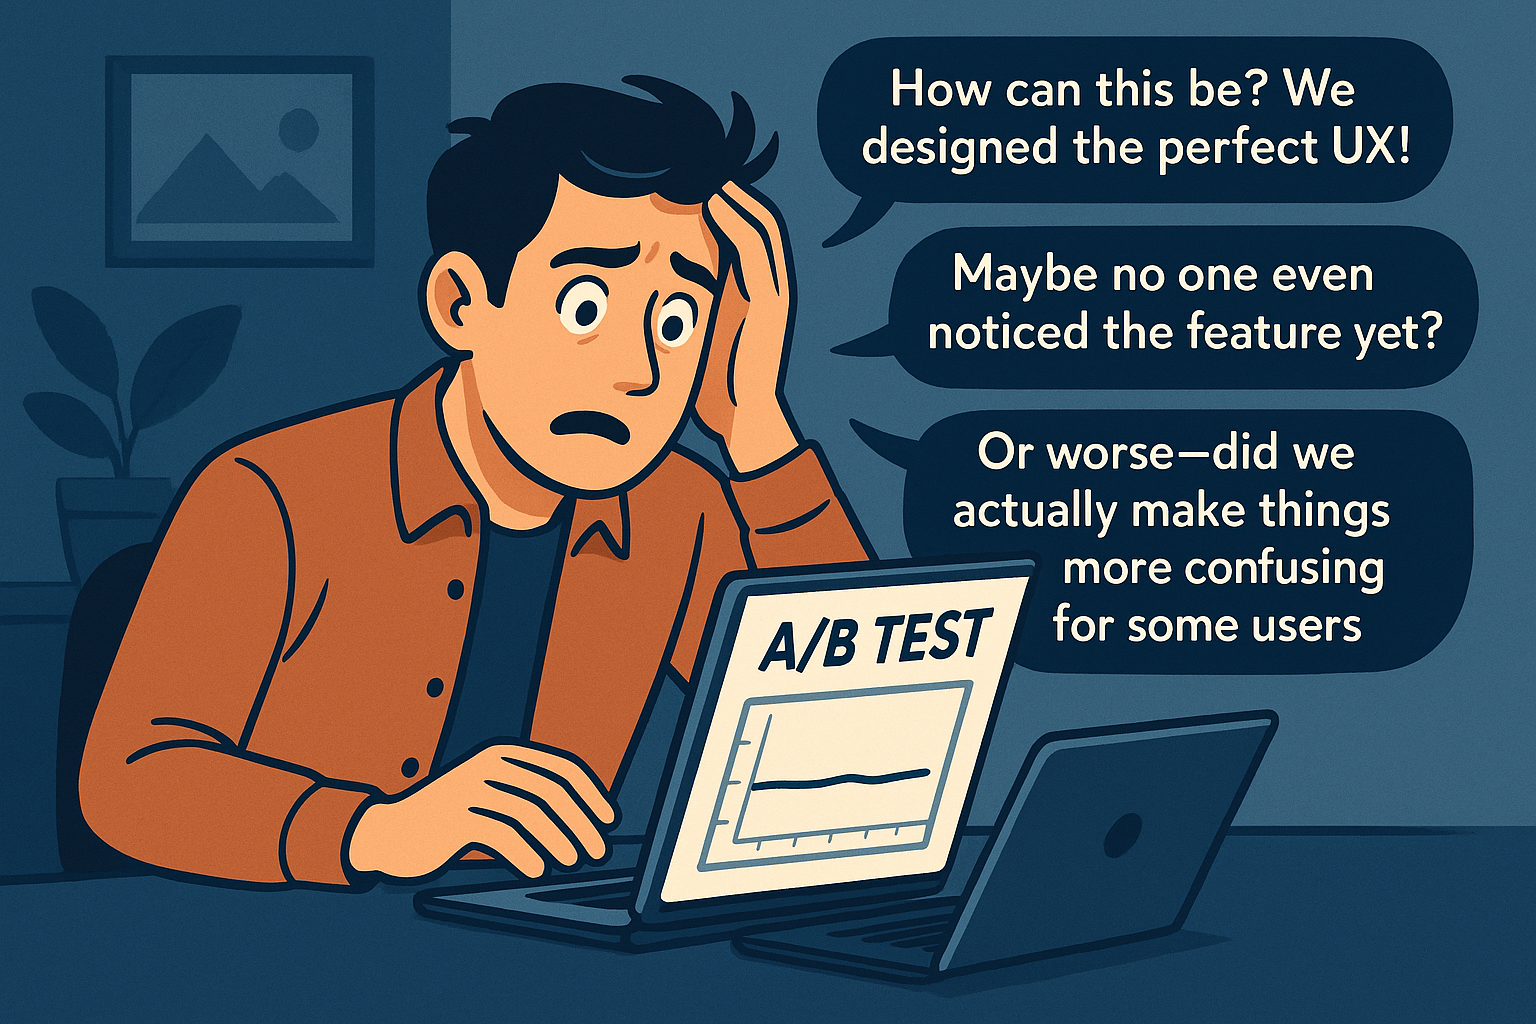
Your team’s months of effort risks being dismissed with a single verdict: no impact. Without clear learnings, there’s no steering wheel for the next iteration. The questions in your head multiply with no obvious answers.
This is where the data-analysis team gets the late-night Slack ping: “Please dive into the results and find *something* we can act on.”
Traditional analysis is basically a manual cycle of hypothesize-slice-test-repeat:
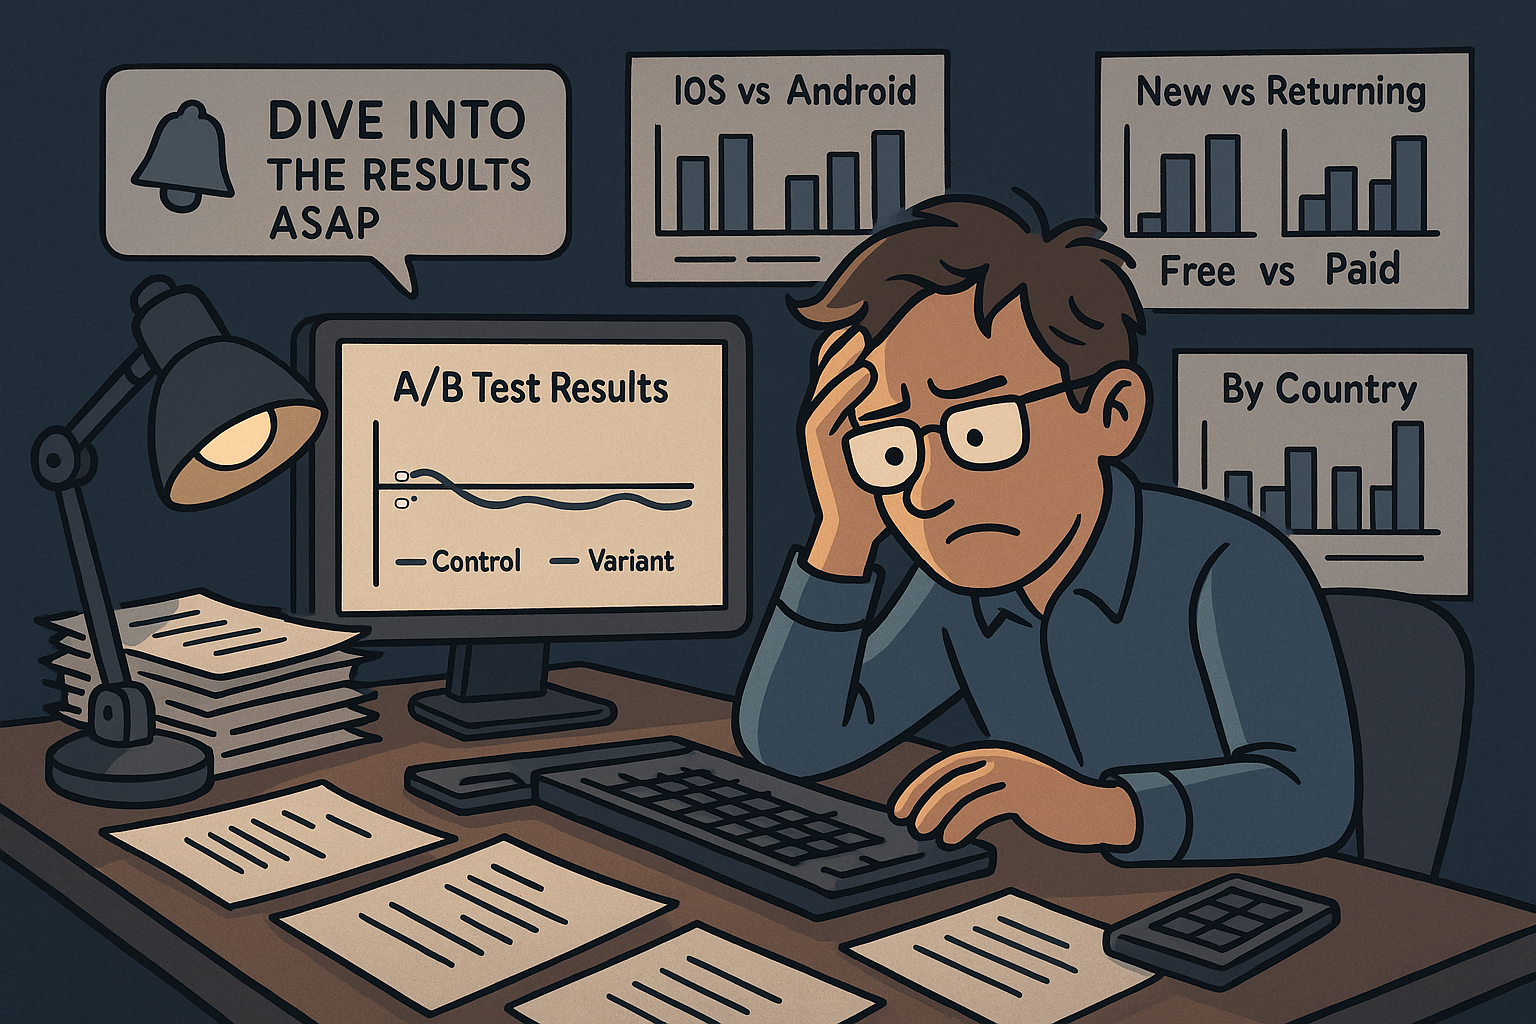
It’s like searching for a single needle in a stack of haystacks. Occasionally you stumble on a statistically significant difference, but is it real signal or a false positive from peeking at too many segments? And discovering complex intersections—say, “new iOS users on the free plan who logged in within the last 30 days” — is nearly impossible by human intuition alone.
To escape the tyranny of averages, we turn to Causal Inference. For this use case, our secret weapon is the Causal Tree.
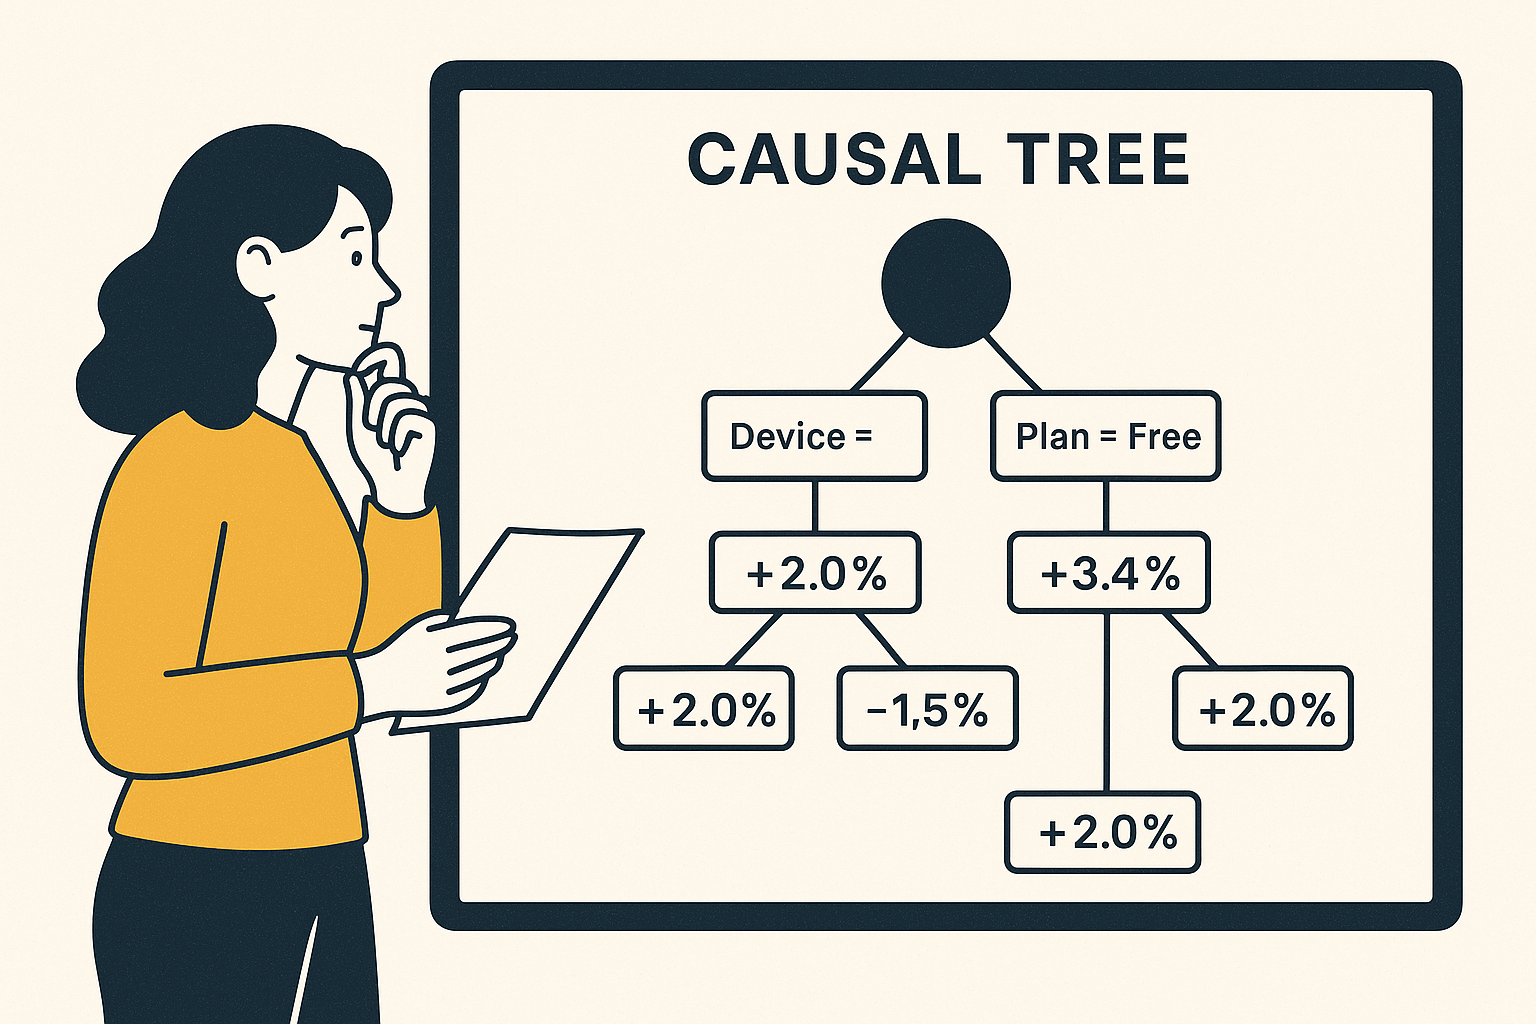
Put simply, a Causal Tree automatically surfaces segments where the treatment effect—your KPI lift—differs the most, and visualizes them as an intuitive decision tree. Instead of manually slicing, you let the data tell you where performance diverges.
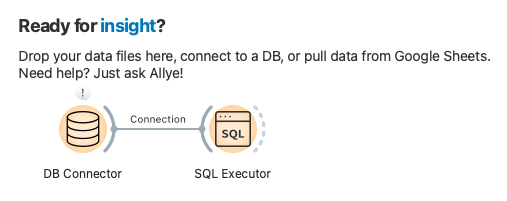
Allye packages Causal Trees into a no-code, visual workflow. Here’s all you need to do:
Use the DB Connector node to connect to your database, then add the SQL Executor node to query your A/B test data. Make sure your data includes user attributes, a `treatment` column (1 = exposed to the feature), and an `outcome` column (e.g., `clicked`, `converted`).
In Allye’s canvas, drag the Causal Tree node into place and open its config panel:
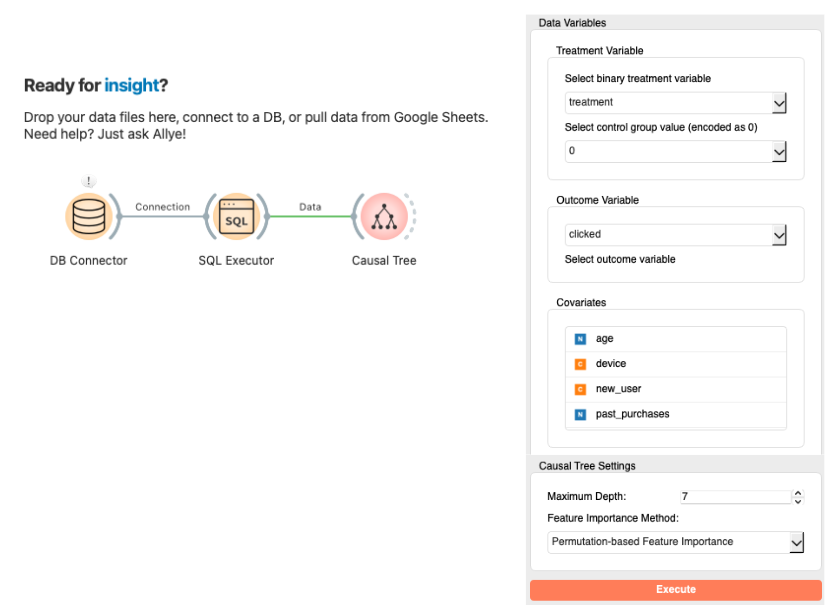
Hit Execute. Allye trains the Causal Tree and instantly delivers:
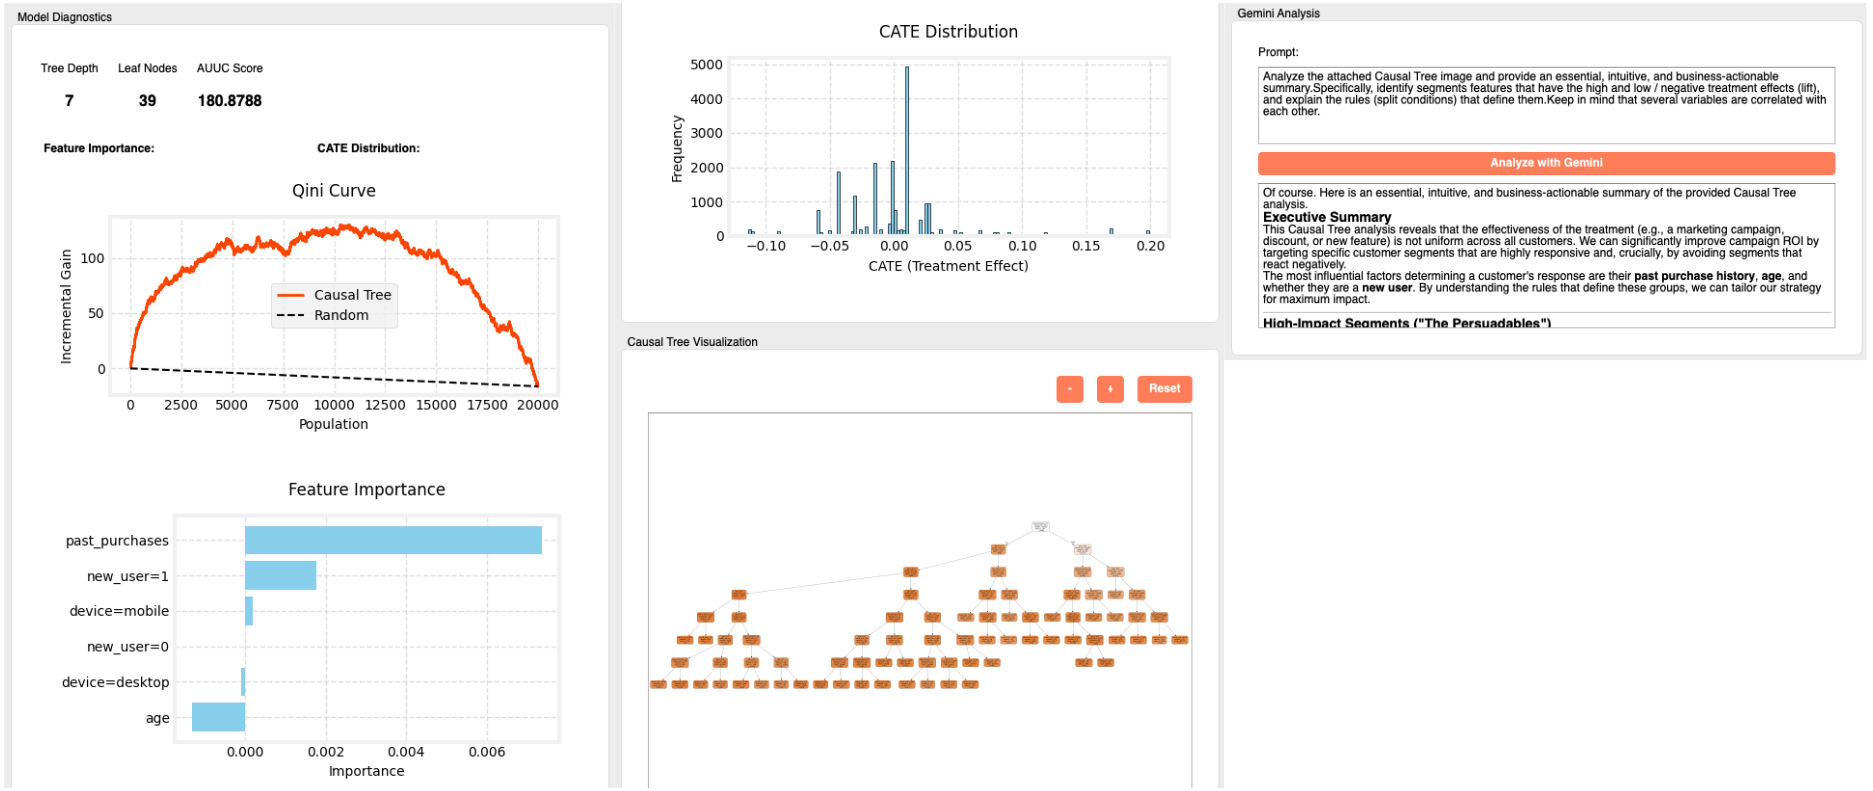
Gemini might summarize findings like:
> Segments with a strong positive lift
> Existing users aged 25-34 on mobile, 3+ sessions/week: CTR +11.2%
> Loyal buyers (≥ 5 past purchases): CTR +9.5%
>
> Segments with a negative lift
> New desktop users: CTR −4.8%
> Users 65+: CTR −3.2%
Armed with this, you can craft the next sprint:
What looked like a neutral test hides stark contrasts:
In five minutes, Allye transforms a “failed” test into a roadmap for growth. No more guesswork—your next strategy is literally highlighted.